Schelling's segregation model
I had a try at Schelling’s segregation model, as described on quant-econ.
In the model, agents are one of two types and live on (x,y) coordinates. They’re happy if at least half of their closest 10 neighbors are of the same types, else they move to a new location.
My codes are simpler than the solutions at the link, but I actually like them like this. In my codes, agents just move to a random new location if they’re not happy. In the quant-econ example they keep moving until their happy. And I just simulate this for fixed number of cycles, not until everyone is happy.
In Matlab:
n     = 1000;          % number of agents of one type
N     = 2*n;           % total number of agents
T     = 10;            % number of cycles

locs  = rand(N, 2);    % initial location
types = [ones(n, 1);   % generate two types
         zeros(n, 1)];

figure
set(gca, 'FontSize', 16)
scatter(locs((types == 1), 1), locs((types == 1), 2))
hold on
scatter(locs((types == 0), 1), locs((types == 0), 2))
title('Cycle 0')
print('test0', '-dpng')
hold off

for t = 1:T
    for i = 1:N
        % All other agents
        others = [locs(1:(i-1),:);
                  locs((i+1):end,:)];

        % Distance to other agents
        dist = pdist2(locs(i,:), others)';

        % Nearest other agents
        [~, ix] = sort(dist);
        nearestAgents = (ix <= 10);

        % Neighbors of same type
        sameNeighbors = sum(types(i) == types(nearestAgents));

        % Happy if at least 5 of neighbors are same type
        isHappy = (sameNeighbors >= 5);

        % If not happy, then move to random new location
        if not(isHappy)
            locs(i,:) = rand(1, 2);
        end
    end
    fprintf('Finished cycle %d/%d.\n', t, T)

    figure
    set(gca, 'FontSize', 16)
    scatter(locs((types == 1), 1), locs((types == 1), 2))
    hold on
    scatter(locs((types == 0), 1), locs((types == 0), 2))
    title(['Cycle ', num2str(t)])
    print(['test', num2str(t)], '-dpng')
    hold off
end
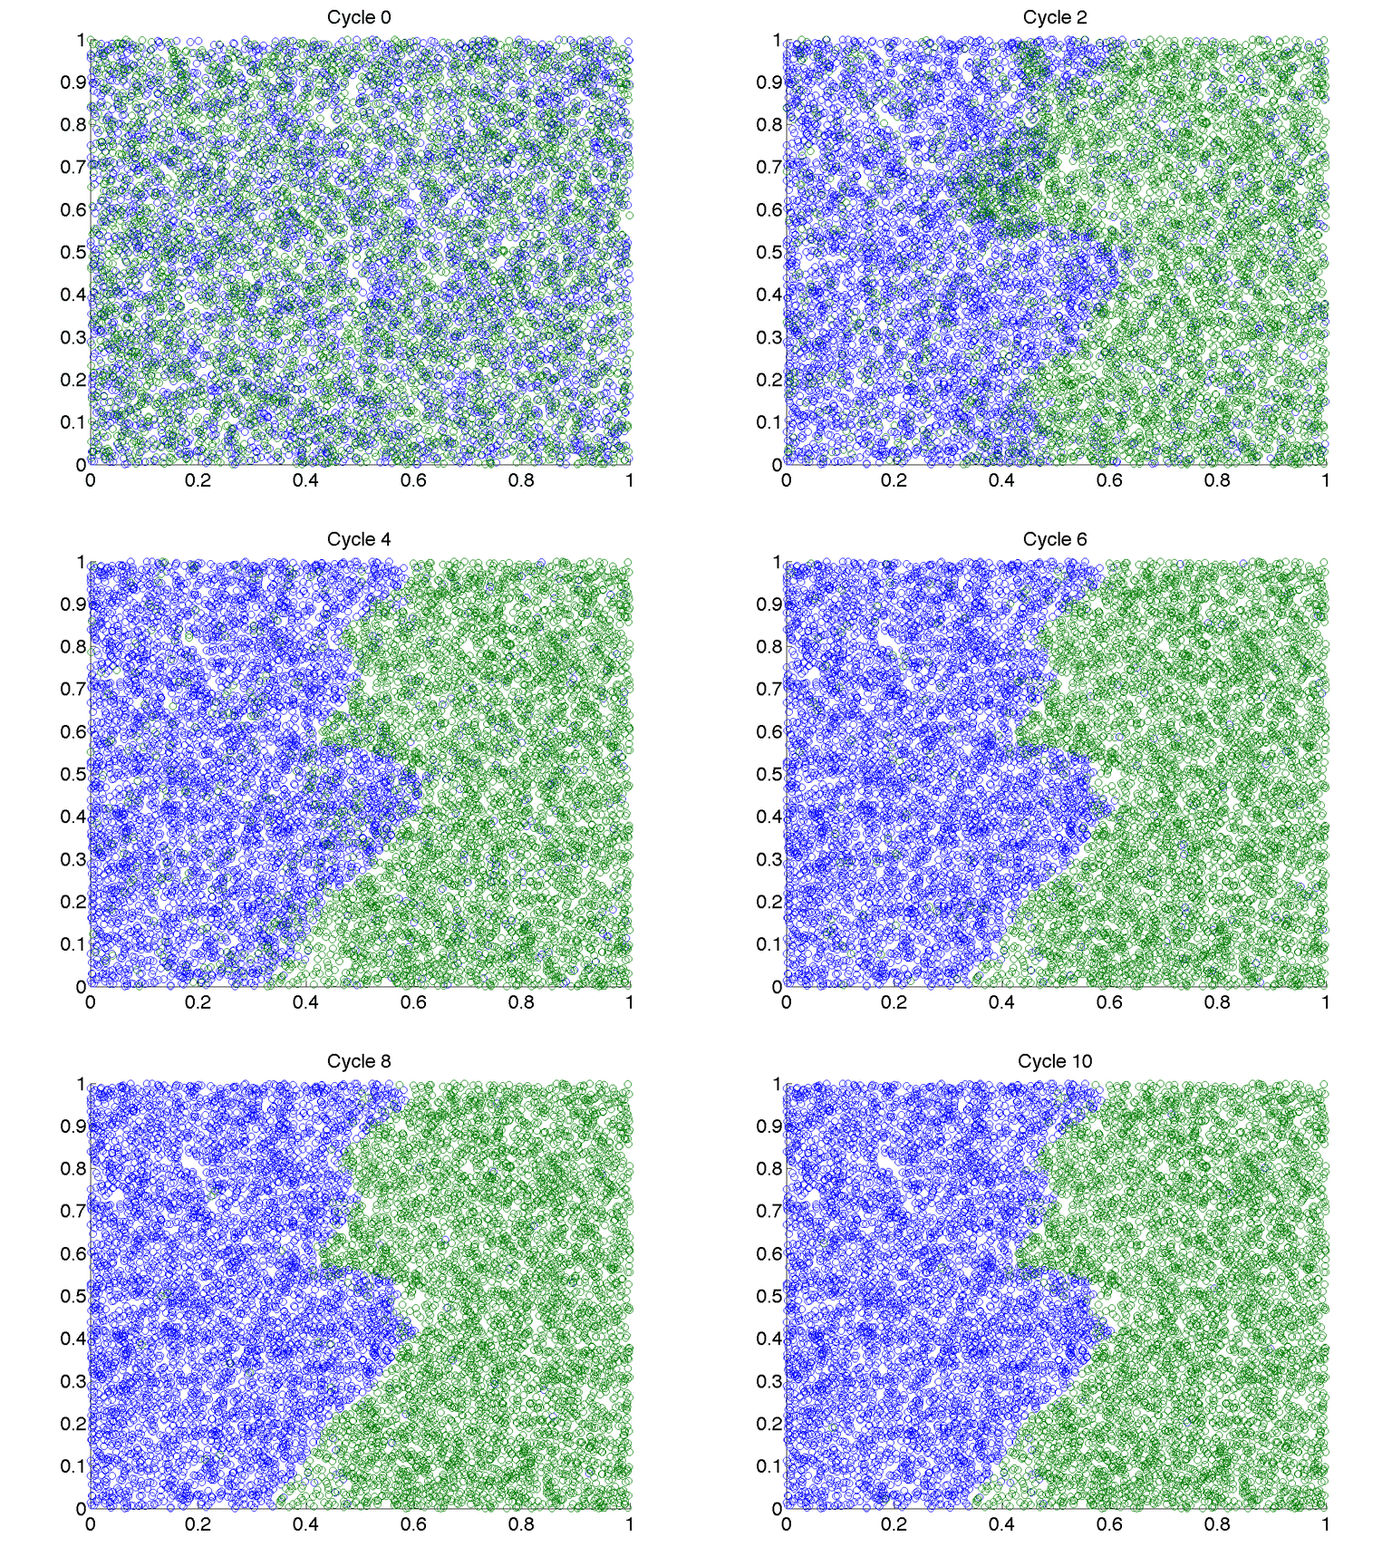
Which yields the following sequence of images:

The two groups separate quickly. Most of the action takes place in the first few cycles and after the remaining minority types slowly move away into their type’s area.
In the paper, Schelling emphasizes the importance of where agents draw their boundaries:
In spatial arrangements, like a neighborhood or a hospital ward, everybody is next to somebody. A neighborhood may be 10 percent black or white; but if you have a neighbor on either side, the minimum nonzero percentage of neighbors of either opposite color is fifty. If people draw their boundaries differently, we can have everybody in a minority: at dinner, with men and women seated alternately, everyone is outnumbered two to one locally by the opposite sex but can join a three-fifths majority if he extends his horizon to the next person on either side.